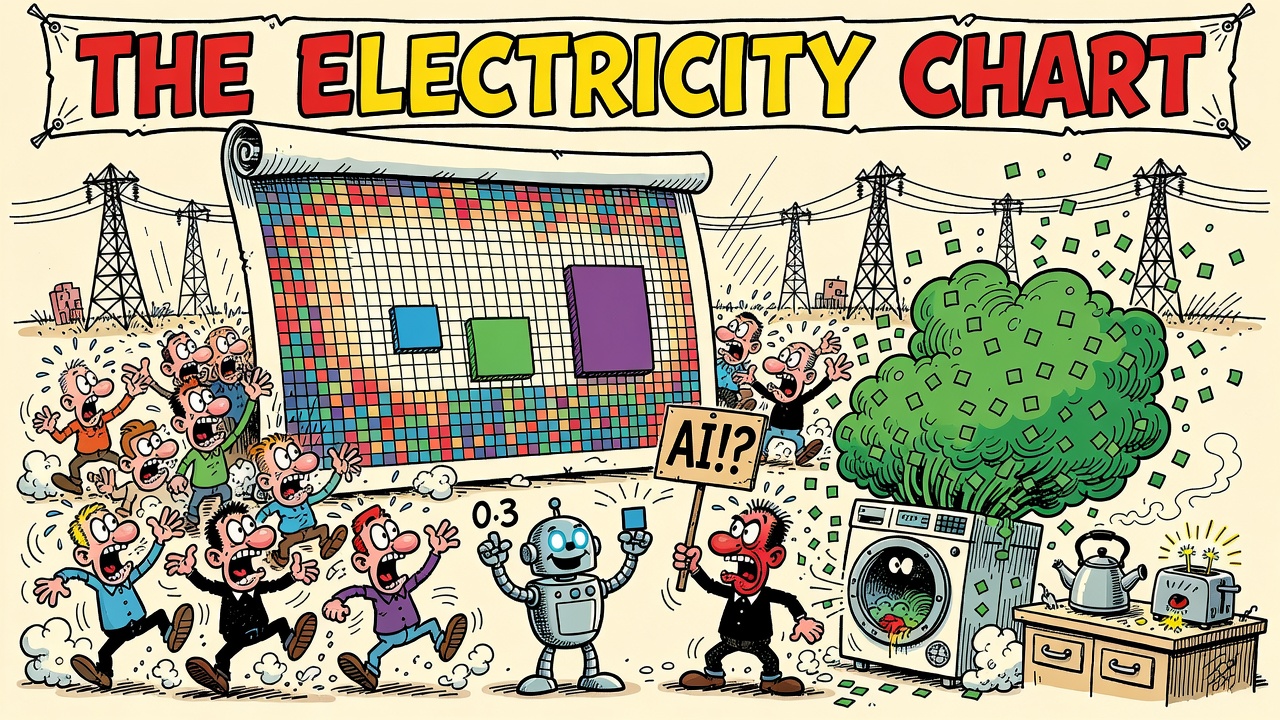
Every square below is a fixed amount of electrical energy, drawn in blocks of fifty
(10 wide, 5 tall). Each chart’s squares are worth hundreds to thousands of the
chart before — the exchange rate is drawn between the charts — and the
entire previous chart reappears as the dashed cluster at the top of the next one.
AI shows up on every single chart: as a rounding error at the top of the page
(one query) and as a nation-scale load at the bottom (the global fleet).
Both facts are true. Most arguments consist of quoting one and ignoring the other.
HOW TO READ THIS: one block = 50 squares; things smaller than one square are drawn
as a partial square. Rows with a yellow wash are AI or
data-center loads. Dashed boxes are everything on the previous chart, combined,
redrawn at this chart’s scale. The ★ row is the energy it took to make
this very chart.