You are looking at V1 of this chart, preserved for the record (its combined totals bubbled up to slivers — the current version fixes that). The living chart is one directory up.
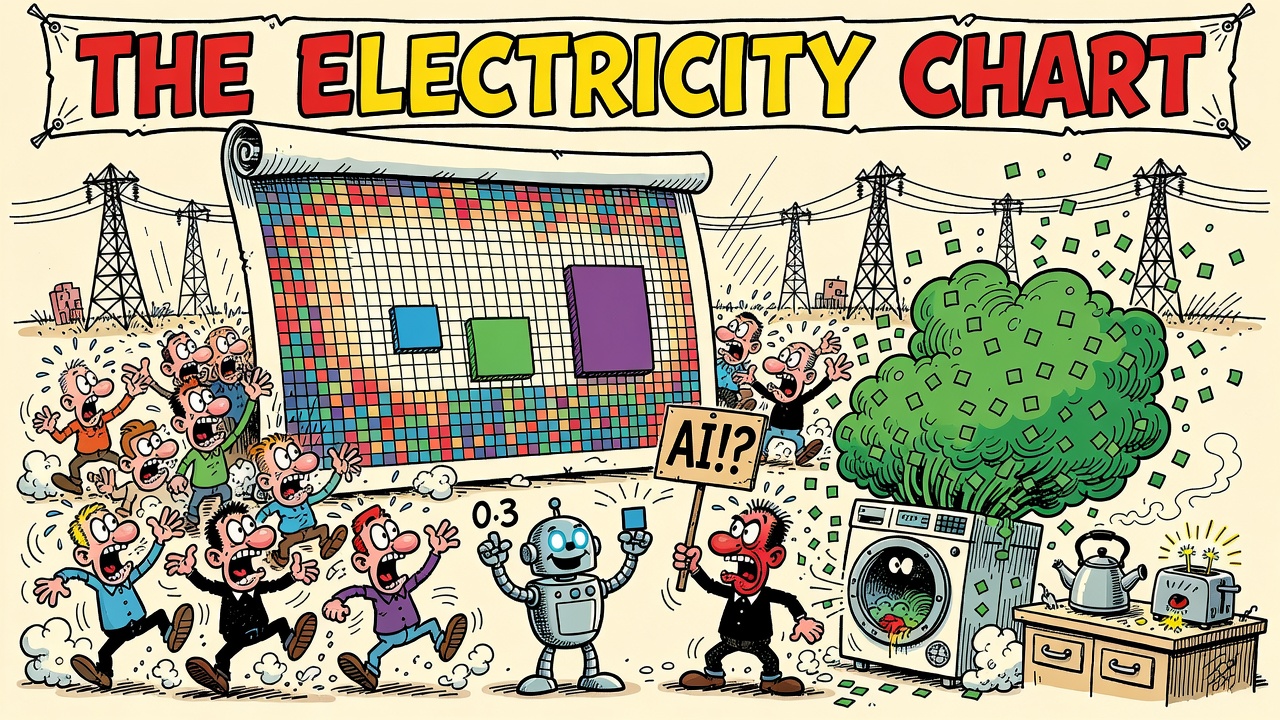
THE ELECTRICITY CHART
…and where AI actually lives on it
Every square on a chart below represents some amount of electrical energy. Each chart’s squares are worth 1,000× the previous chart’s — so one square at the bottom of the page equals everything on the chart above it, combined.
AI shows up on every single chart: as a rounding error at the top of the page (one query) and as a nation-scale load at the bottom (the global fleet). Both facts are true. Most arguments consist of quoting one and ignoring the other.
Format shamelessly borrowed from xkcd’s radiation dose chart.
HOW TO READ THIS: things smaller than one square are drawn as a partial square.
Rows with a yellow wash are AI or data-center loads.
Dashed boxes are everything on the previous chart, combined.
The ★ row is the energy it took to make this very chart.

